In case you hadn’t noticed evidence is mounting of a massive value-added and growth score train wreck. I’ve pointed out previously on this blog that there exist some pretty substantial differences in the models and estimates of teacher and school effectiveness being developed in practice across states for actual use in rating, ranking, tenuring and firing teachers – and rating teacher prep programs – versus the models and data that have been used in high profile research studies. This is not to suggest that the models and data used in high profile research studies are ready for prime time in high stakes personnel decisions. They are not. They reveal numerous problems of their own. But many if not most well-estimated, carefully vetted value-added models used in research studies a) test alternative specifications including use of additional covariates at the classroom and school level, or include various “fixed effects” to better wash away potential bias and b) through this process, end up using substantially reduced samples of teachers for whom data on substantial samples of students across multiple sections/classes within year and across years are available (see, for example: http://nepc.colorado.edu/files/NEPC-RB-LAT-VAM_0.pdf ). Constraints imposed in research to achieve higher quality analyses often result in loss of large numbers of cases, and result potentially in clearer findings, which makes similar approaches infeasible where the goal is not to produce the most valid research but instead to evaluate the largest possible number of teachers or principals (where seemingly, validity should be an even greater concern).
Notably, even where these far cleaner data and far richer models are applied, critical evaluators of the research on the usefulness of these value-added models suggest that… well… there’s just not much there.
Haertel:
My first conclusion should come as no surprise: Teacher VAM scores should emphatically not be included as a substantial factor with a fixed weight in consequential teacher personnel decisions. The information they provide is simply not good enough to use in that way. It is not just that the information is noisy. Much more serious is the fact that the scores may be systematically biased for some teachers and against others… (p. 23)
Rothstein on Gates MET:
Hence, while the report’s conclusion that teachers who perform well on one measure “tend to” do well on the other is technically correct, the tendency is shockingly weak. As discussed below (and in contrast to many media summaries of the MET study), this important result casts substantial doubt on the utility of student test score gains as a measure of teacher effectiveness.
A really, really, important point to realize is that the models that are actually being developed, estimated and potentially used by states and local public school districts for such purposes as determining which teachers get tenure, or determining teacher bonuses or salaries, who gets fired… or even which teacher preparation institutions get to keep their accreditation?…. those models increasingly appear to be complete junk!
Let’s review what we now know about a handful of them:
New York City
I looked at New York City value-added findings when the teacher data were released a few years back. I would argue that the New York City model is probably better than most I’ve seen thus far and its technical documentation reveals more thorough attempts to resolve common concerns about bias. Yet, the model, by my cursory analysis still fails to produce sufficiently high quality information for confidently judging teacher effectiveness.
Among other things, I found that only in the most recent year, were the year over year correlations even modest, and the numbers of teachers in the top 20% for multiple years running astoundingly low. Here’s a quick summary of a few previous posts:
Math – Likelihood of being labeled “good”
- 15% less likely to be good in school with higher attendance rate
- 7.3% less likely to be good for each 1 student increase in school average class size
- 6.5% more likely to be good for each additional 1% proficient in Math
Math – Likelihood of being repeatedly labeled “good”
- 19% less likely to be sequentially good in school with higher attendance rate (gr 4 to 8)
- 6% less likely to be sequentially good in school with 1 additional student per class (gr 4 to 8)
- 7.9% more likely to be sequentially good in school with 1% higher math proficiency rate.
Math [flipping the outcome measure] – Likelihood of being labeled “bad”
- 14% more likely to be bad in school with higher attendance rate.
- 7.9% more likely to be sequentially bad for each additional student in average class size (gr 4 to 8)
http://schoolfinance101.wordpress.com/2012/02/28/youve-been-vam-ifi...
New York State
Then there are the New York State conditional Growth Percentile Scores. First, here’s what the state’s own technical report found:
Despite the model conditioning on prior year test scores, schools and teachers with students who had higher prior year test scores, on average, had higher MGPs. Teachers of classes with higher percentages of economically disadvantaged students had lower MGPs. (p. 1) http://schoolfinance101.files.wordpress.com/2012/11/growth-model-11-12-air...
And in an astounding ethical lapse, only a few paragraphs later, the authors concluded:
The model selected to estimate growth scores for New York State provides a fair and accurate method for estimating individual teacher and principal effectiveness based on specific regulatory requirements for a “growth model” in the 2011-2012 school year. p. 40 http://engageny.org/wp-content/uploads/2012/06/growth-model-11-12-air-t...
Concerned about what they were seeing, Lower Hudson Valley superintendents commissioned an outside analysis of data on their teachers and schools provided by the state. Here is a recent Lower Hudson Valley news summary of the findings of that report:
But the study found that New York did not adequately weigh factors like poverty when measuring students’ progress.
“We find it more common for teachers of higher-achieving students to be classified as ‘Effective’ than other teachers,” the study said. “Similarly, teachers with a greater number of students in poverty tend to be classified as ‘Ineffective’ or ‘Developing’ more frequently than other teachers.”
Andrew Rice, a researcher who worked on the study, said New York was dealing with common challenges that arise when trying to measure teacher impact amid political pressures.
“We have seen other states do lower-quality work,” he said.
http://www.lohud.com/article/20131015/NEWS/310150042/Study-faults-NY-s-tea...
That’s one heck of an endorsement, eh? We’ve seen others do worse?
Perhaps most offensive is that New York State a) requires that if the teacher receives a bad growth measure rating, the teacher cannot be given a good overall rating and b) the New York State Commissioner has warned local school officials that the state will intervene “if there are unacceptably low correlation results between the student growth sub-component and any other measure of teacher and principal effectiveness.” In other words, districts must ensure that all other measures are sufficiently correlated with the state’s own junk measure.
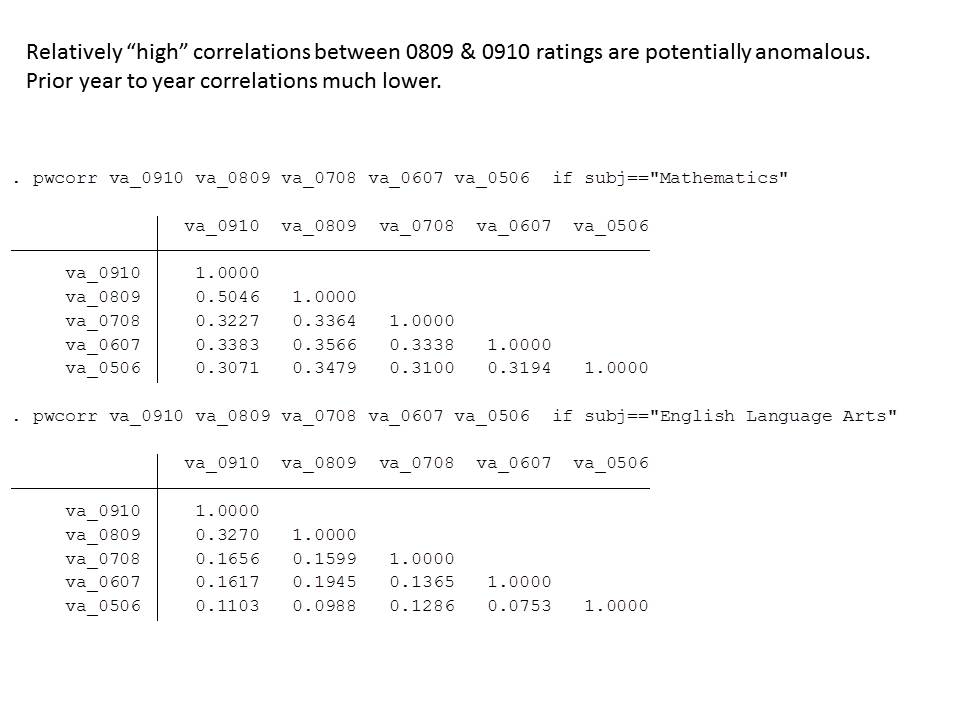
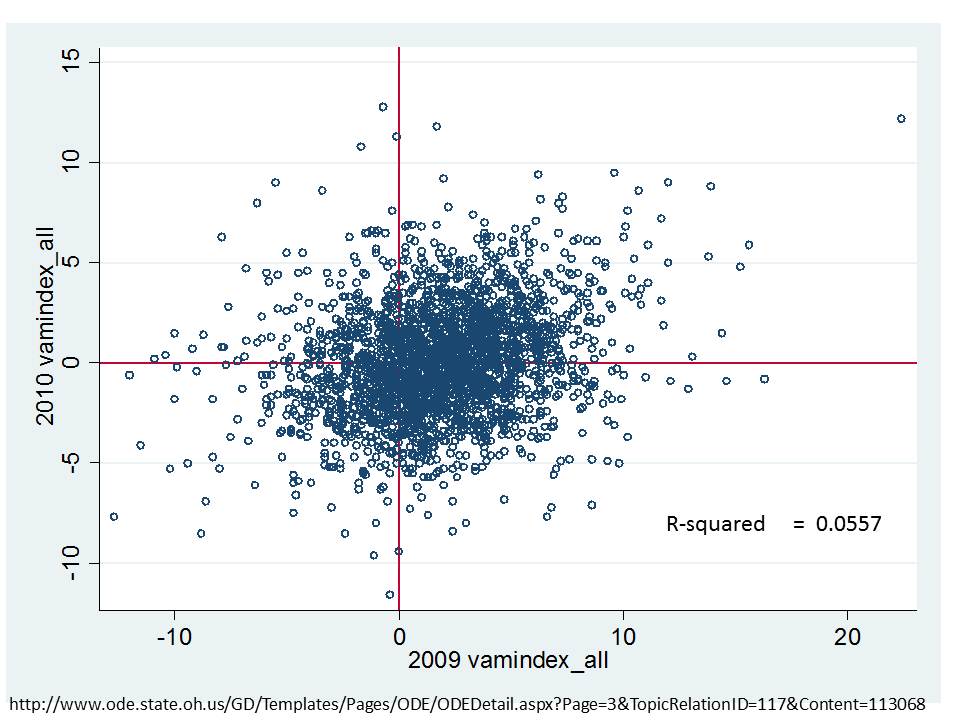
Ohio (school level)
In brief, in my post on Ohio Value Added scores, at the school level, I found that year over year correlations were nearly 0 – the year to year ratings of schools were barely correlated with themselves and on top of that, were actually correlated with things with which they should not be correlated. http://schoolfinance101.wordpress.com/2011/11/06/when-vams-fail-eva...
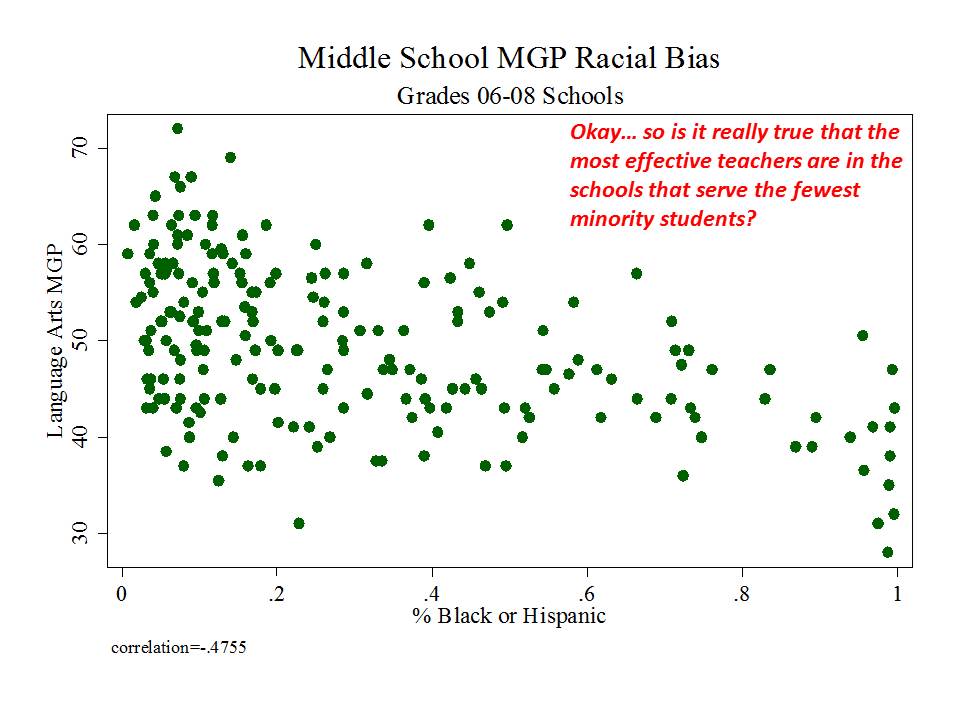
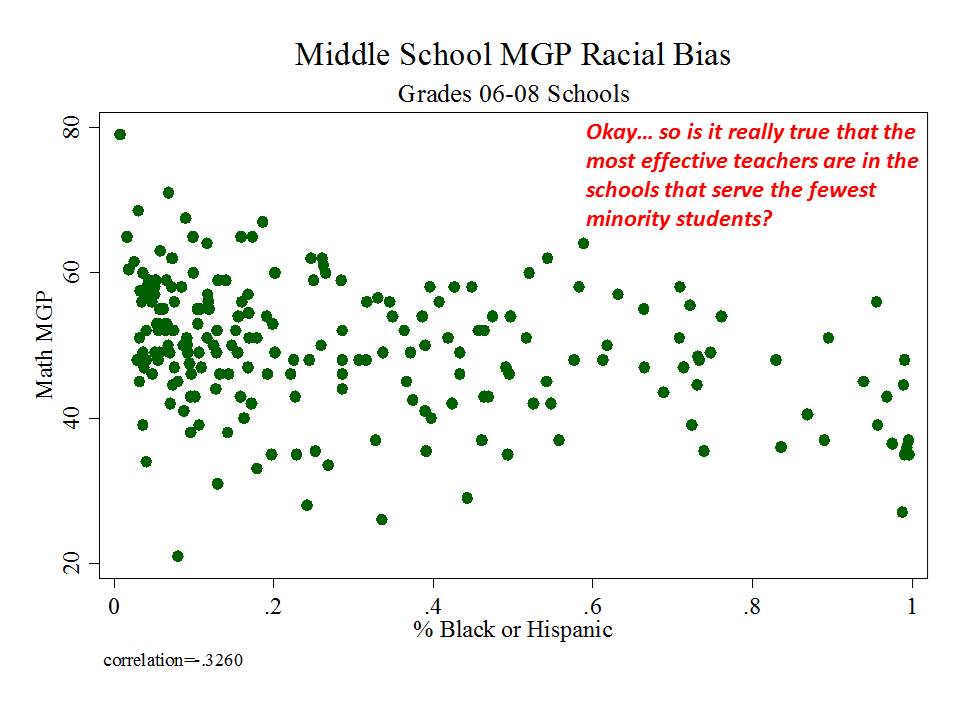
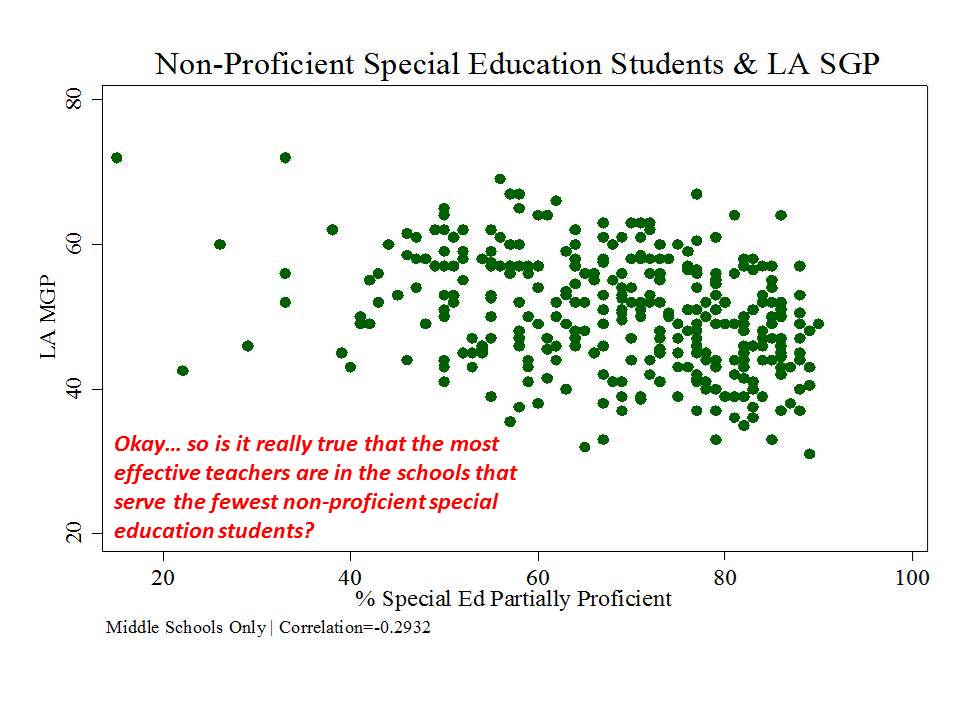
New Jersey (school level)
And then there’s New Jersey, which, while taking a somewhat more measured approach to adoption and use of their measures than in New York, has adopted measures which appear to be among the most problematic I’ve seen.
Here are a few figures:
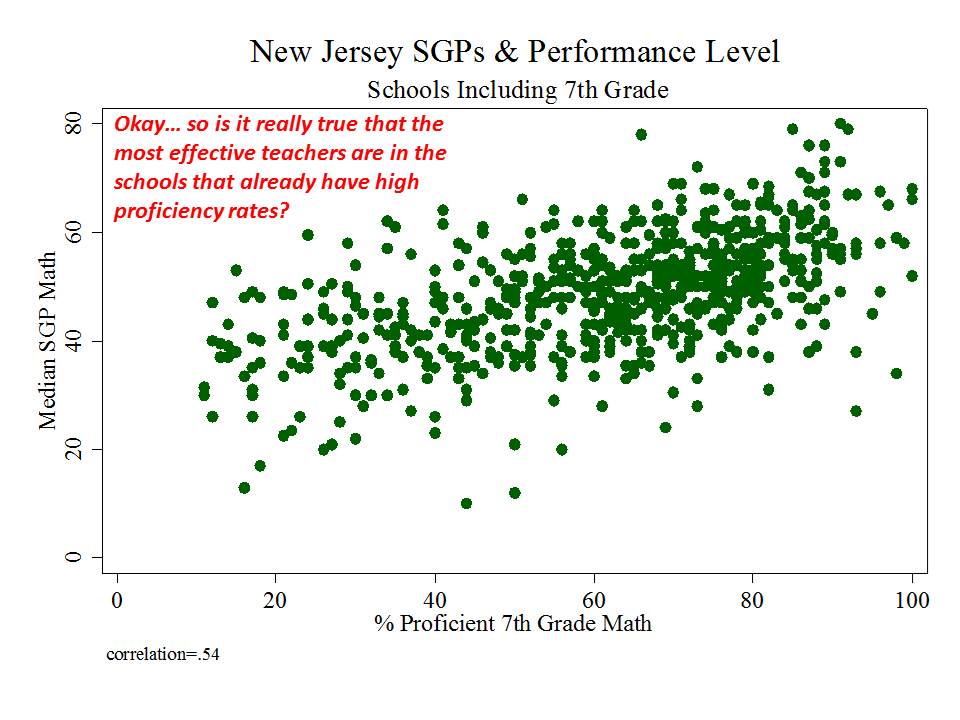
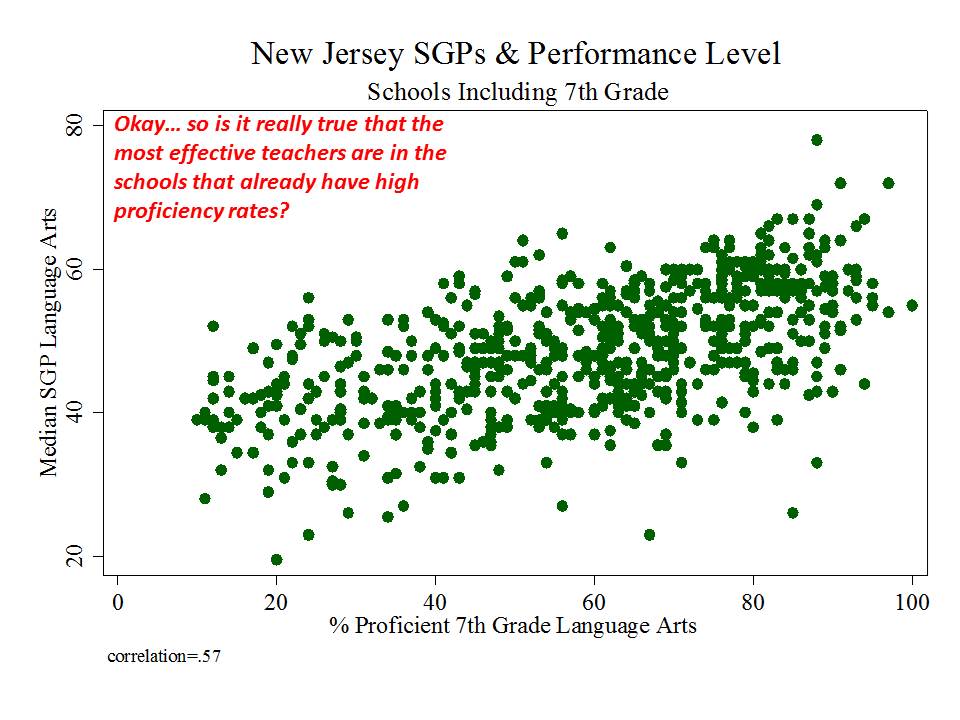
 And here is a link to a comprehensive analysis of these measures and the political rhetoric around them.http://njedpolicy.files.wordpress.com/2013/05/sgp_disinformation_ba...
Conclusions & Implications?
At this point, I’m increasingly of the opinion that even if there was a possible reasonable use of value-added and growth data for better understanding variations in schooling and classroom effects on measured learning, I no longer have any confidence that these reasonable uses can occur in the current policy environment.
What are some of those reasonable uses and strategies?
First, understanding the fallibility of any one model of school or teacher effects is critically important, and we should NEVER, NEVER, NEVER be relying on a single set of estimates from one model specification to make determinations about teacher, or school… or teacher preparation program effectiveness. Numerous analysis using better data and richer models than those adopted by states have shown that teacher, school or other rankings and ratings vary sometimes wildly under different model specifications. It is by estimating multiple different models and seeing how the rank orders and estimates change that we can get some better feel for what’s going on (knowing what we’ve changed in our models), and whether or the extent to which our models are telling us anything useful. The political requirement of adopting a single model forces bad decision making and bad statistical interpretation.
Second, at best the data revealed by multiple alternative models might be used as exploratory tools in large systems to see where things appear to be working better or worse, with respect to producing incremental changes in test scores, where test scores exist and are perceived meaningful. That’s a pretty limited scope to begin with. But informed statistical analysis may provide guidance on where to look more closely – which classrooms or schools to observe more frequently. But, these data will never provide us definitive information that can or should be used as a determinative factor in high stakes personnel decisions.
But that’s precisely the opposite of current policy prescriptions.
Unlike a few years back, when I was speculating that such problems might lead to a flood of litigation regarding the fairness of using these measures for rating, ranking and dismissing teachers, we now have substantial information that these problems are real.
Even more so from a litigation perspective, we have substantial information that policy makers have been made aware of these problems – especially problems of bias in rating systems – and that some policymakers, most notably New York’s John King have responded with complete disregard.
Can we just make it all stop! ???
You need to be a member of School Leadership 2.0 to add comments!
Join School Leadership 2.0